discover · compare · collections · requirements · contribute · feed · watching · stats · help with your tokens
mingrammer/diagrams · source
Snapshot 0 · 2026-11-04T12:47:26Z · Python · MIT
Content fingerprint
fafb9552f356fafa2bc3aedd08e7e519aeb550150329c324ccb5096e1ed730d2GitHub description at capture
:art: Diagram as Code for prototyping cloud system architectures
README at capture
 # Diagrams [](/LICENSE) [](https://badge.fury.io/py/diagrams)   [](https://www.tickgit.com/browse?repo=github.com/mingrammer/diagrams)  <a href="https://www.buymeacoffee.com/mingrammer" target="_blank"><img src="https://www.buymeacoffee.com/assets/img/custom_images/orange_img.png" alt="Buy Me A Coffee" style="height: 41px !important;width: 174px !important;box-shadow: 0px 3px 2px 0px rgba(190, 190, 190, 0.5) !important;" ></a> **Diagram as Code**. Diagrams lets you draw the cloud system architecture **in Python code**. It was born for **prototyping** a new system architecture design without any design tools. You can also describe or visualize the existing system architecture as well. Diagrams currently supports main major providers including: `AWS`, `Azure`, `GCP`, `Kubernetes`, `Alibaba Cloud`, `Oracle Cloud` etc... It also supports `On-Premises` nodes, `SaaS` and major `Programming` frameworks and languages. **Diagram as Code** also allows you to **track** the architecture diagram changes in any **version control** system. > NOTE: It does not control any actual cloud resources nor does it generate cloud formation or terraform code. It is just for drawing the cloud system architecture diagrams. ## Providers                  ## Getting Started > Want to try it first? The [**online playground**](https://diagrams.mingrammer.com/playground/) runs **diagrams** right in your browser — no installation required. It requires **Python 3.9** or higher, check your Python version first. It uses [Graphviz](https://www.graphviz.org/) to render the diagram, so you need to [install Graphviz](https://graphviz.gitlab.io/download/) to use **diagrams**. After installing graphviz (or already have it), install the **diagrams**. > macOS users can download the Graphviz via `brew install graphviz` if you're using [Homebrew](https://brew.sh). ```shell # using pip (pip3) $ pip install diagrams # using pipenv $ pipenv install diagrams # using poetry $ poetry add diagrams ``` You can start with [quick start](https://diagrams.mingrammer.com/docs/getting-started/installation#quick-start). Check out [guides](https://diagrams.mingrammer.com/docs/guides/diagram) for more details, and you can find all available nodes list in [here](https://diagrams.mingrammer.com/docs/nodes/aws). ## Playground [**diagrams.mingrammer.com/playground**](https://diagrams.mingrammer.com/playground/) A free online editor for **diagrams**: write Diagram as Code in Python and see the rendered architecture diagram instantly, without installing Python or Graphviz. It runs the real **diagrams** package in your browser via [Pyodide](https://pyodide.org), and supports node search, autocompletion, PNG/SVG/JPEG export, and shareable links. See the [playground guide](https://diagrams.mingrammer.com/docs/getting-started/playground) for details. ## Examples | Event Processing | Stateful Architecture | Advanced Web Service | | ------------------------------------------------------------ | ------------------------------------------------------------ | ------------------------------------------------------------ | | 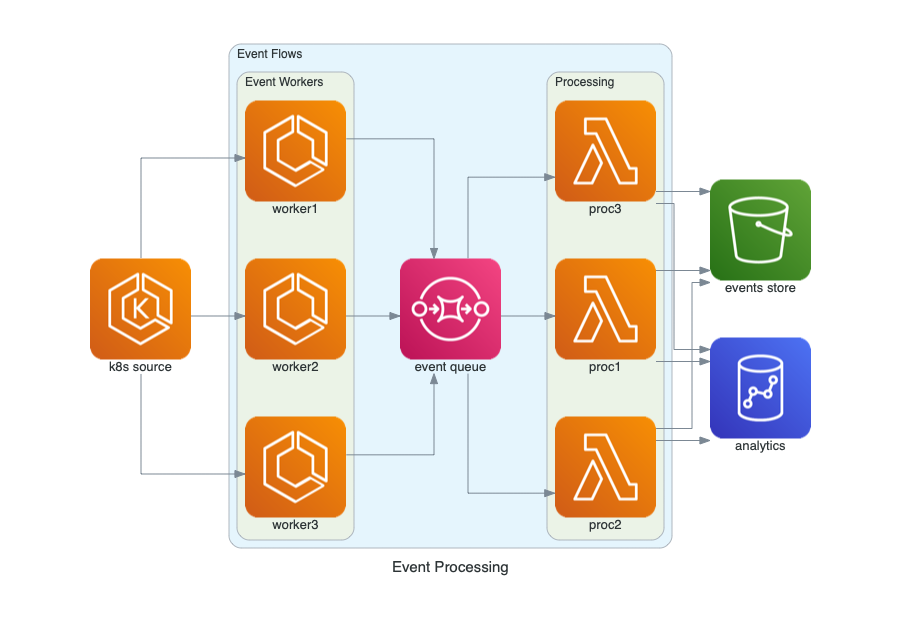 | 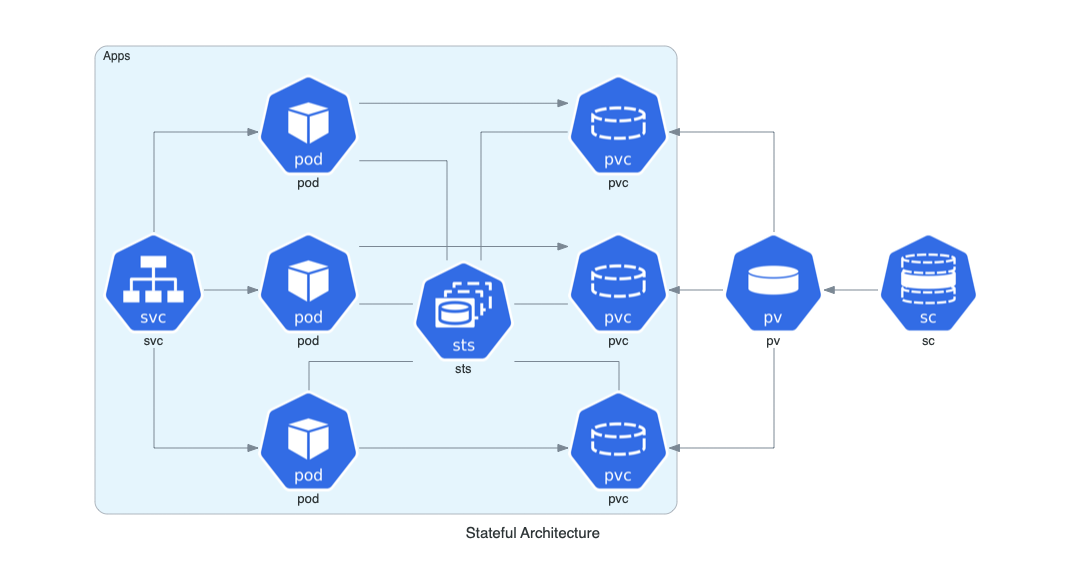 | 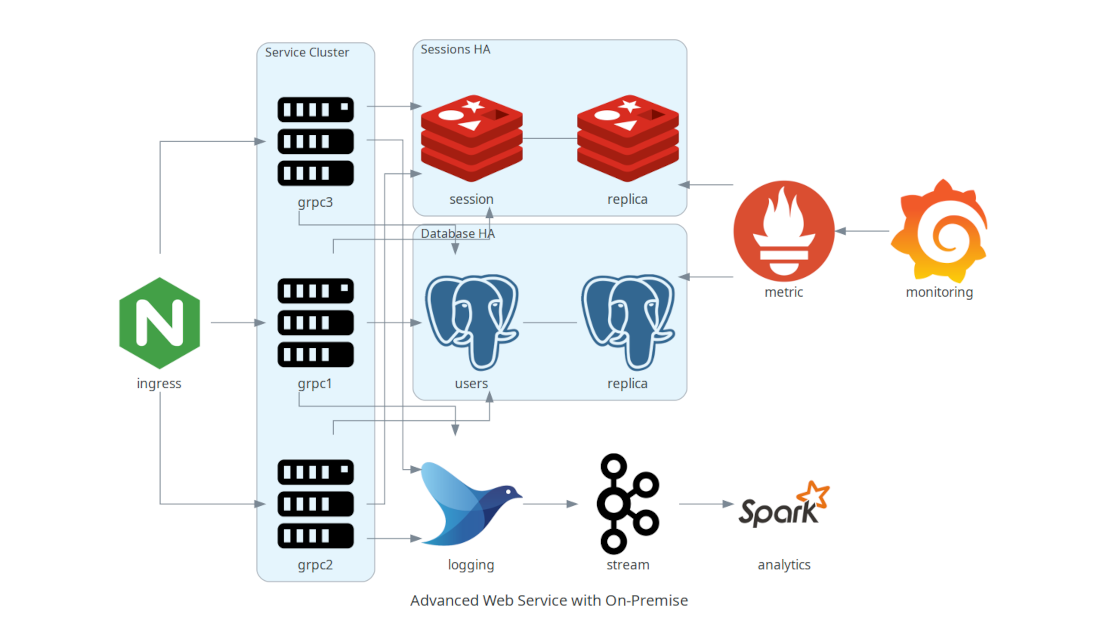 | You can find all the examples on the [examples](https://diagrams.mingrammer.com/docs/getting-started/examples) page. ## Contributing To contribute to diagram, check out [contribution guidelines](CONTRIBUTING.md). > Let me know if you are using diagrams! I'll add you in showcase page. (I'm working on it!) :) ## Who uses it? [Apache Airflow](https://github.com/apache/airflow) is the most popular data workflow Orchestrator. Airflow uses Diagrams to generate architecture diagrams in their documentation. [Cloudiscovery](https://github.com/Cloud-Architects/cloudiscovery) helps you to analyze resources in your cloud (AWS/GCP/Azure/Alibaba/IBM) account. It allows you to create a diagram of analyzed cloud resource map based on this Diagrams library, so you can draw your existing cloud infrastructure with Cloudiscovery. [Airflow Diagrams](https://github.com/feluelle/airflow-diagrams) is an Airflow plugin that aims to easily visualise your Airflow DAGs on service level from providers like AWS, GCP, Azure, etc. via diagrams. [KubeDiagrams](https://github.com/philippemerle/KubeDiagrams) is a tool to generate Kubernetes architecture diagrams from Kubernetes manifest files, kustomization files, Helm charts, and actual cluster state. [KubeDiagrams](https://github.com/philippemerle/KubeDiagrams) supports all Kubernetes built-in resources, any custom resources, and label-based resource clustering. [AWS CloudFormation Diagrams](https://github.com/philippemerle/AWS-CloudFormation-Diagrams) is a simple CLI script to generate AWS architecture diagrams from AWS CloudFormation templates. ## Other languages - If you are familiar with Go, you can use [go-diagrams](https://github.com/blushft/go-diagrams) as well. ## License [MIT](LICENSE)